Well-being (life satisfaction) peaks in our late 40s and it’s all downhill from there. Declining health, growing dependence, increasing loneliness, deepening depression and regret. “What a drag it is getting old,” crooned Mick Jagger. Or is it?
Up with “U”!
Despite the infirmities of ageism, overall psychological well-being generally rises with age, researchers tell us.
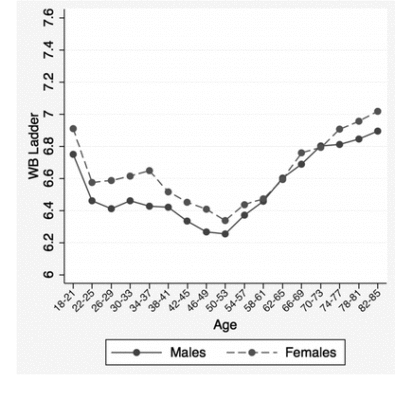
 “Well-being tends to follow a roughly U‑shaped curve through life,” report economists David Blanchflower and Andrew Oswald (2007), who examined life satisfaction among 500,000 randomly sampled Americans and western Europeans.
Numerous studies have validated this curve shape, whereby well-being peaks in youth and old age, and bottoms out somewhere around a person’s 40s or 50s.
Chart source: Proceedings of the National Academy of Sciences, Angus Deaton et al. (2010).
Why is happiness U‑shaped?
It may simply be the trajectory of modern living. Young adults begin with high hopes and dreams, anticipating a bright future. By the late 30s to mid-40s, however, careers and children impose ever-greater responsibilities. What needs to be done expands, but the available time doesn’t. Elevated levels of stress, worry, and anger evoke a sense of losing control. Life blurs. Many experience some disillusion with their life as they realize that their youthful ambitions will never be fulfilled. Resigned that they “blew it,” the suicide rate is the highest of any age group.
Then, in their late 40s or early 50s, well-being makes a strong comeback. Responsibilities and obligations diminish and control fades. Children leave, grandkids hatch. Aspirations recede as expectations adjust downward to align with reality. Emotional reactions to missed chances decrease with age and regret mellows. Many reconcile with themselves and reappraise life’s purpose and meaning. Well-being soars.
The U‑shaped curve in human well-being may also be a product of how we think. Economist Hannes Schwandt (2013) analyzed more than 130,000 expectations (what they wanted) matched to subsequent realizations (what they got). Schwandt found clear evidence that people systematically fail to accurately predict how satisfied they will be with their well-being five years hence (projection trap*), and how these errors change over their lives. Across the socio-economic spectrum, he concluded, young people strongly overestimate their future life satisfaction while the elderly tend to underestimate it.
Other factors have been found to influence the shape. How upbeat you are is often decisive, along with learning to adapt and live your life better. Generational differences matter, since you may have been born in particularly good (or bad) economic times or social conditions. Where you live is also important. A Princeton University study titled Subjective wellbeing, health, and ageing (2014), surveyed 160 countries and found that the U‑shaped curve only exists in high-income, English-speaking countries, which includes the United States, Canada, the United Kingdom, Australia, and New Zealand. Chances are, you lucked out.
Monkey see, monkey do.
Studies of chimpanzee and orangutan behavior reveal a similar U‑shaped pattern of happiness. The oldest and youngest show the highest well-being in the community, with a dip in the thirties, the primates’ equivalent of middle age. Anyone for a banana? Go ape!
Grow old with me! The best is yet to be.
~ Robert Browning, poet
* Questionable beliefs can “trap” our better judgment, leading to poor decisions and unintended consequences. In the projection trap, we often focus attention solely on our immediate situation or condition and fail to anticipate the longer-term implications. Learn more about this, and other traps, in the Young Person’s Guide to Wisdom, Power, and Life Success.
Image credit: “Caylee” by Christopher Gahran, licensed by permission of copyright holder (2014).


